
c h a r t s | g r a p h s
Creation of charts and graphs, at times including complex data. Dynamic infographic design.

Stacked bar chart using custom key with colored icons to symbolize the level of adherence

Data Trends layout focused on female cancer statistics

Infographic using map regions and markers to hold statistical data

Line graphs enhanced visually with color coding
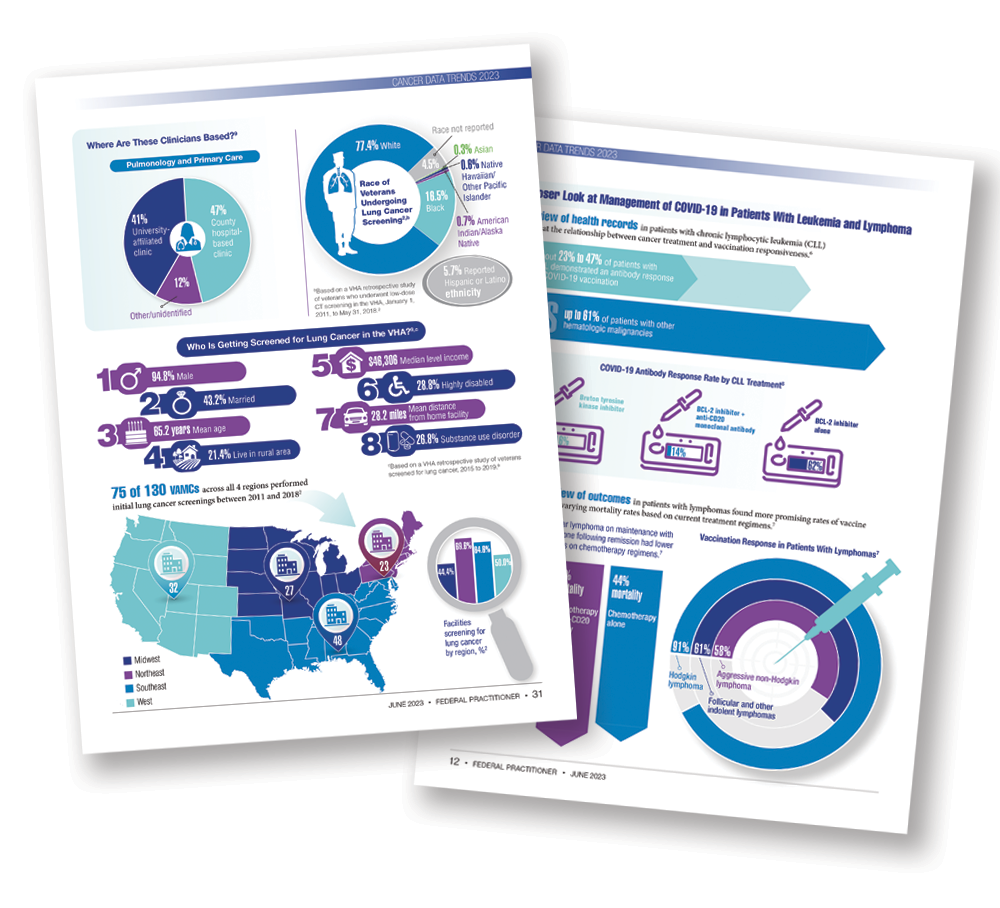
Data Trends Supplement - infographics
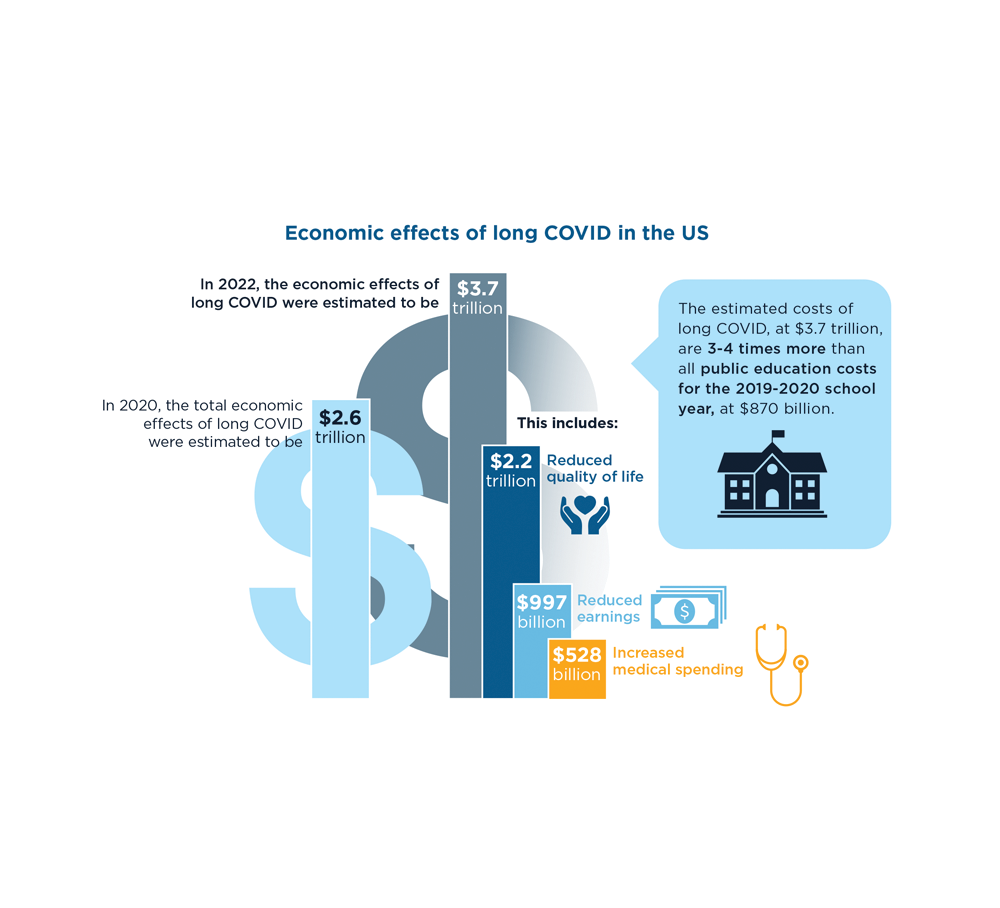
Bar chart set into $ symbol showing levels of spending

Data organization for digital slide presentation